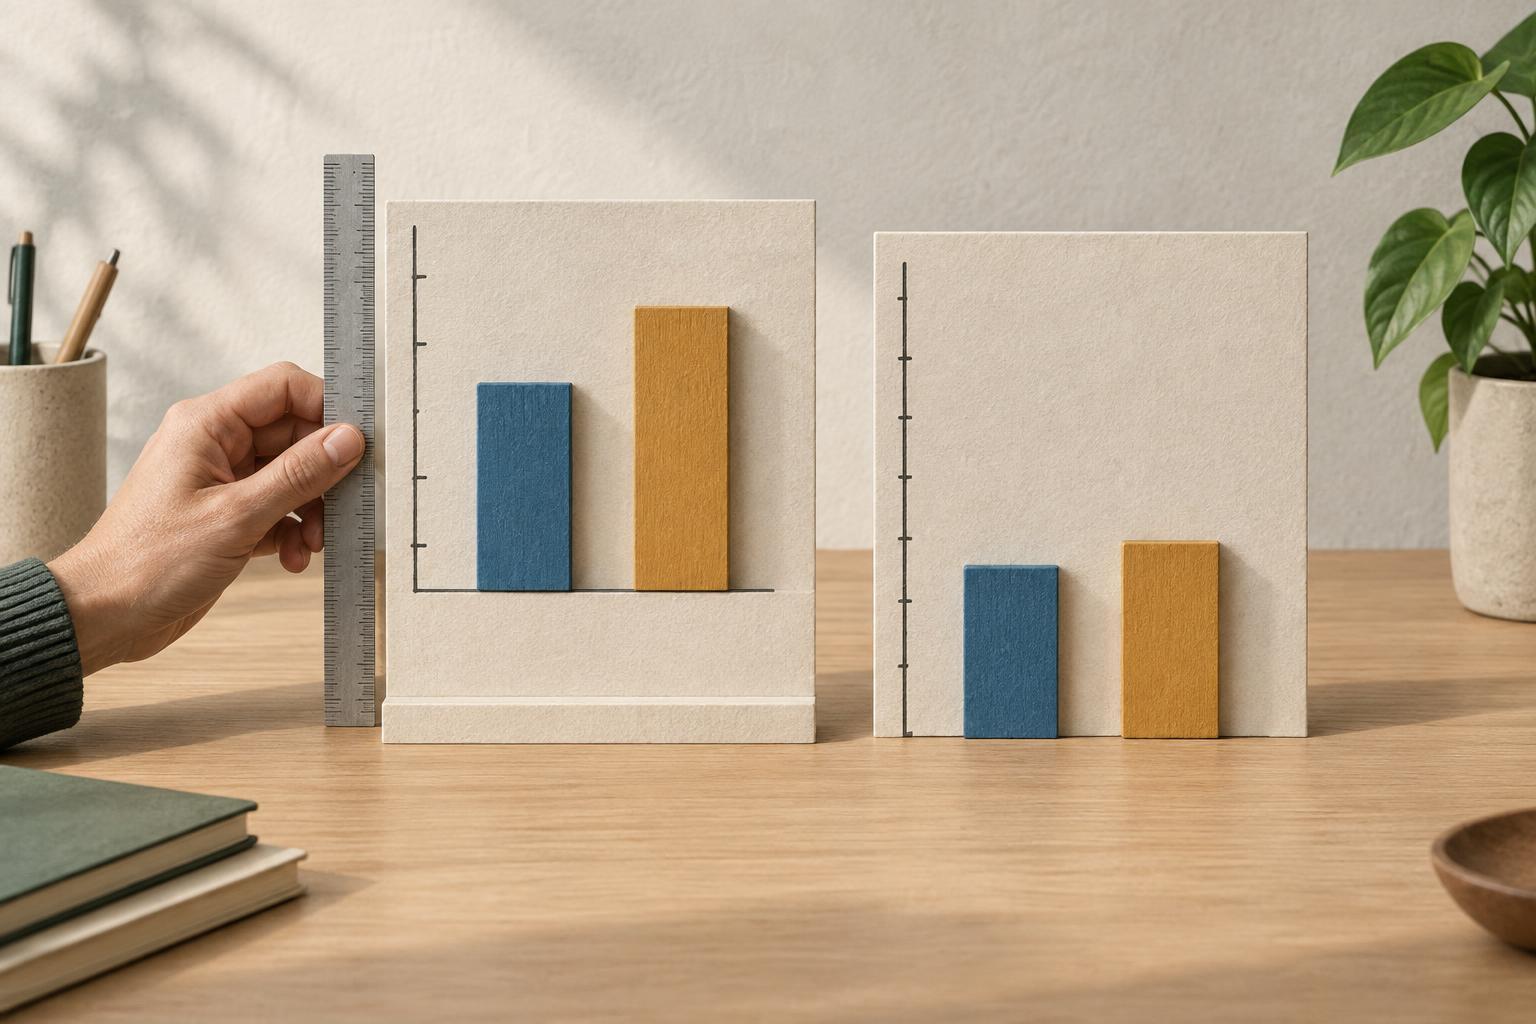
Why the shape of a chart matters
Charts turn numbers into visual distances. A taller bar suggests a larger quantity; a steep line suggests rapid change. Those impressions depend not only on the data but also on the axes used to display it. If an axis starts above zero or its labels are spaced unevenly, a small numerical difference can appear dramatic.
That does not mean every chart with an unusual scale is wrong. A focused scale can make subtle changes easier to see. The problem arises when the display encourages a conclusion that the underlying numbers do not support, or when readers cannot tell how the scale works. Reading the labels is therefore as important as looking at the overall shape.
What a truncated axis does
A truncated axis begins somewhere other than zero, leaving out part of the numerical range. Imagine a bar chart comparing values of 96 and 100. If its vertical axis begins at zero, the bars look nearly the same height. If it begins at 94, the second bar may look several times taller. The difference is still four units; only its visual presentation has changed.
This matters especially for bar charts because readers often compare the full lengths of the bars. When zero is missing, those lengths no longer represent the full quantities. A clearly labeled truncated scale may be useful for examining a narrow difference, but it should not be mistaken for a picture of the values’ relative sizes. Showing the numbers on the bars or providing a companion view that starts at zero can help readers keep both perspectives in mind.
Line charts require a little more judgment. They commonly emphasize movement rather than total magnitude, so a nonzero starting point can reveal changes that a broad scale would hide. Even then, the chosen range affects how steep a trend appears. Before describing a rise as sharp or a decline as slight, check the numerical change and the units involved.
How uneven scales change the story
An axis can also mislead through irregular spacing. Suppose a horizontal axis places January, February and June at equal distances without indicating that several months separate the last two points. A line connecting them makes the change from February to June look as quick as the change from January to February. The plotted values may be correct, but the implied pace is not.
On a numerical axis, equal physical distances should represent equal changes unless a different scale is clearly identified. Look for skipped values, inconsistent tick intervals or a break symbol. Some charts use a logarithmic scale, where equal distances represent equal ratios rather than equal additions. That can be useful when values span a wide range, but it changes how readers should interpret slopes and gaps. A move from 10 to 100 may occupy the same space as a move from 100 to 1,000: each is tenfold, although the second adds far more units.
Two vertical axes on the same chart deserve similar care. Each series may have a different scale, allowing the lines to appear closely aligned or far apart depending on the chosen ranges. Their visual similarity alone is not evidence that the measures are related.
A quick way to read and improve a chart
Start with the axes before interpreting the pattern. What does each measure, where does it begin and end, and how much does each interval represent? Are time periods equally spaced? Check the actual values behind the most striking bars or points. A dramatic-looking gap may be small in absolute terms, while a modest-looking change may matter in context.
When making a chart, choose a scale that fits the comparison you want readers to make. For bars showing quantities, a zero baseline usually protects the meaning of bar length. For lines showing small changes, a narrower range may be appropriate if the axis is prominent and the values are easy to find. Mark breaks, explain unusual scales and avoid making unequal intervals look equal. If both the overall magnitude and the fine detail matter, consider separate charts rather than asking one scale to do both jobs.
The goal is not to distrust every visual. It is to separate what the data says from what the design makes you feel. A good chart lets readers notice a pattern and verify its size.